Sociogram Project
I improved upon this existing sociogram visualization tool created in VBA by Dr. Rhydian Lewis at The University of Cardiff.
The original tool was created for an educational setting. I tailored and optimized it for a professional soccer club.
The tool allows relationships among and between players and coaches to automatically be visualized in a user-friendly manner.
How it works:
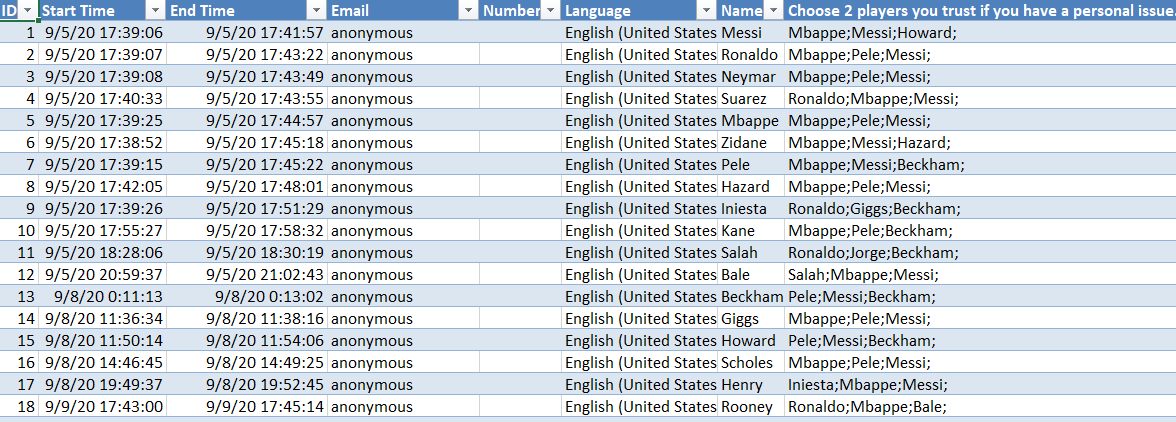
- 1. The Excel-based tool fetches raw data from an online survey that asks coaches and players several questions (names changed for privacy reasons).
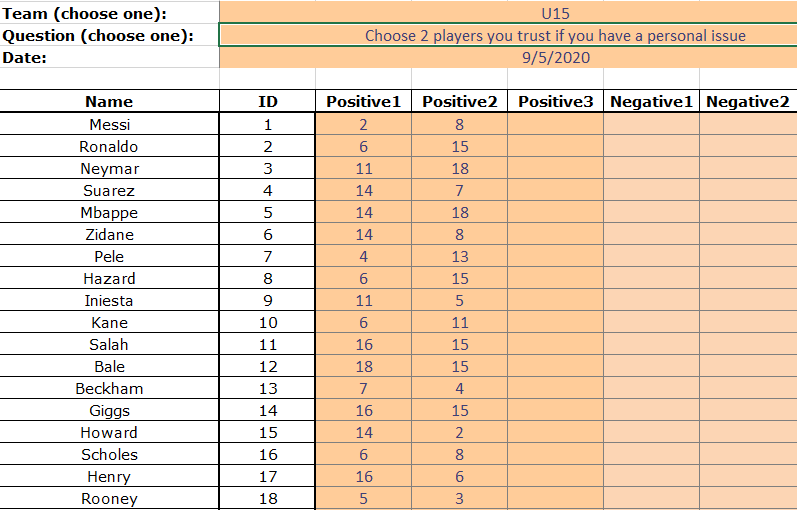
- 2. The data is cleansed and converted into numerical form. The user selects a question to visualize.
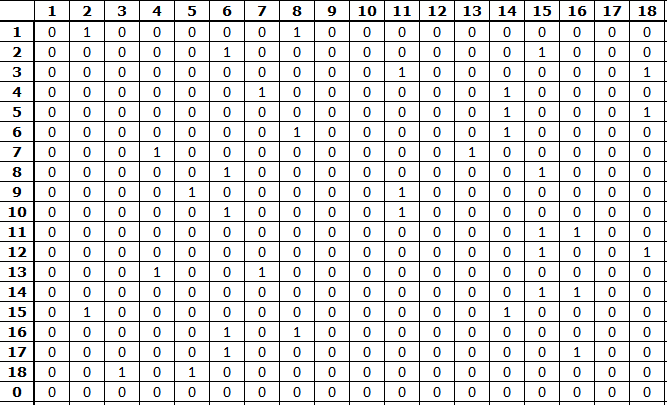
- 3. A matrix is generated that shows which players selected each other based on the input data.
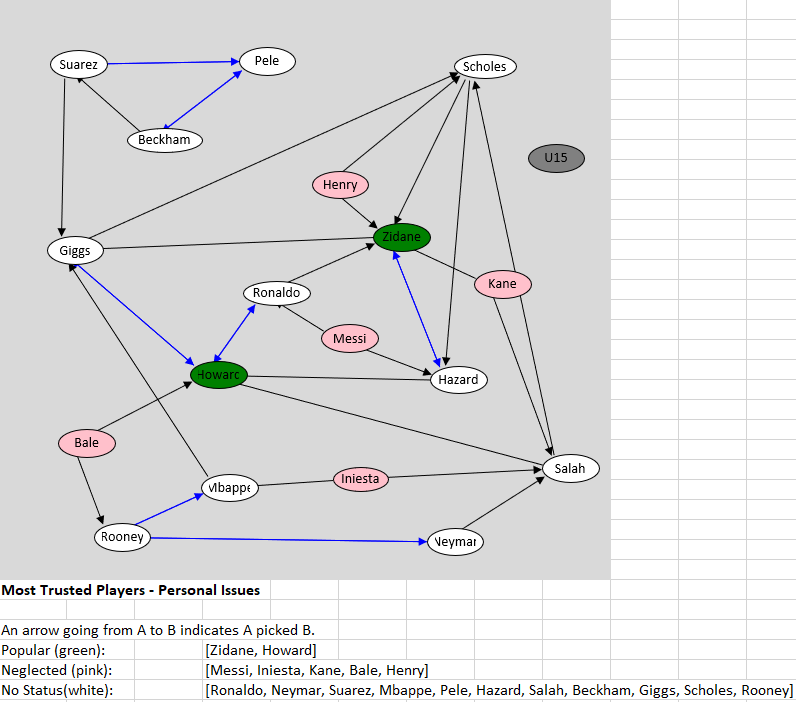
- 4. A sociogram is then drawn, with nodes placed and arrows drawn based on the number of players and the players' responses.